Faster Memory Debugging with Chrome's Quick Source Panel
Tired of jumping between the memory tab and the sources tab in Chrome Developer Tools? I have good news for you! Chrome has a lot of hidden features that can make your life easier.
Enter Quick source. It’s a nifty panel that allows you to view the source code of a selected link in a separate panel instead of the sources tab. I found this immensely helpful when debugging leaks in anonymous functions or closures.
Here’s how to use it:
- Open up your Chrome Developer tools.
- Open the console drawer. (Hit Escape if it’s not already open).
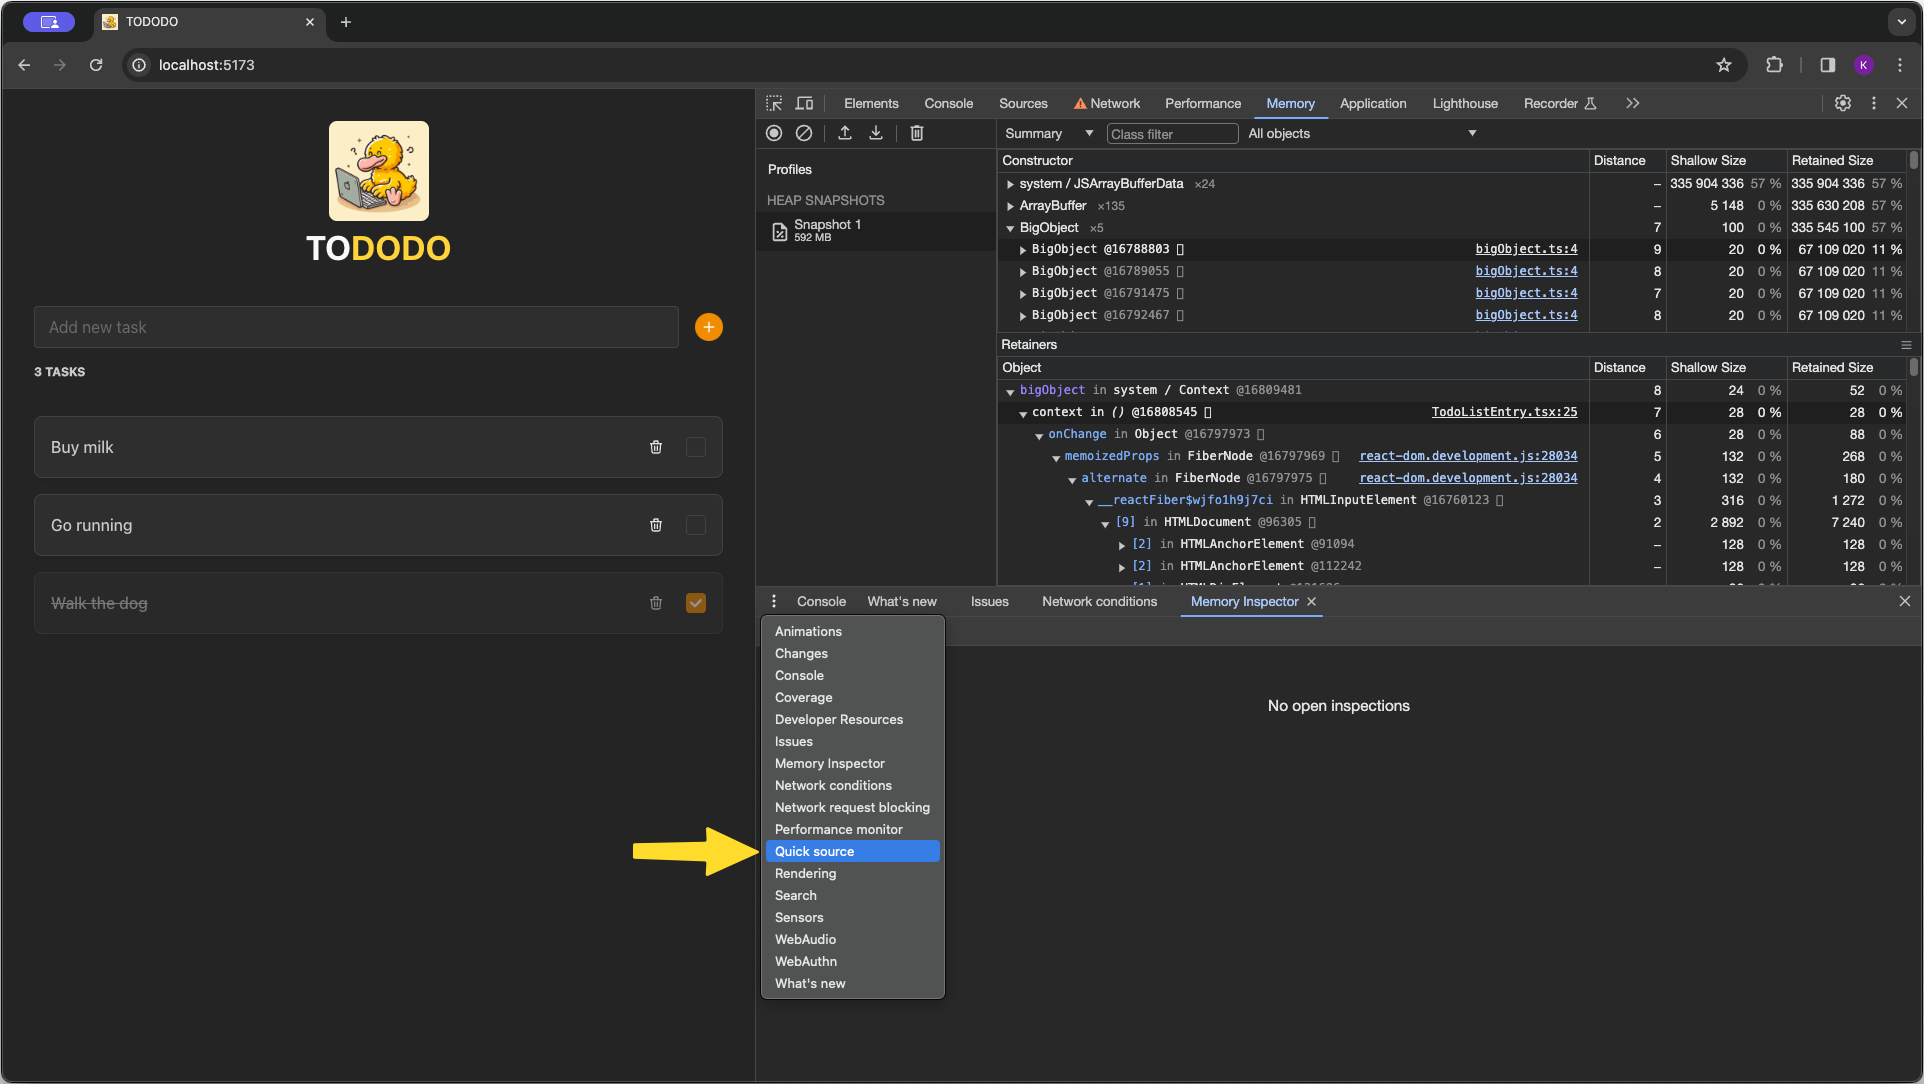
- Go to the upper left corner and click the three dots. There, you’ll find the “Quick source” option.
Opening this panel will change the default behavior of the developer tools to directly open the source code of a selected link in the Quick source panel instead of the sources tab. This way, you can view the retention tree and source code side by side.
This feature is a great time saver, and I hope it helps you as much as it helped me.
Happy debugging!