Sneaky React Memory Leaks: How useCallback and closures can bite you
I work at Ramblr, an AI startup where we build complex React applications for video annotation. I recently encountered a complex memory leak that was caused by a combination of JavaScript closures and React’s useCallback hook. Coming from a .NET background it took me quite some time to figure out what was going on, so I thought I’d share what I learned.
I added a brief refresher on closures, but feel free to skip that part if you’re already familiar with how they work in JavaScript.
A brief refresher on closures
Closures are a fundamental concept in JavaScript. They allow functions to remember the variables that were in scope when the function was created. Here’s a simple example:
function createCounter() {
  const unused = 0; // This variable is not used in the inner function
  let count = 0; // This variable is used in the inner function
  return function () {
    count++;
    console.log(count);
  };
}

const counter = createCounter();
counter(); // 1
counter(); // 2
In this example, the createCounter function returns a new function that has access to the count variable. This is possible because the count variable is in the scope of the createCounter function when the inner function is created.
JavaScript closures are implemented using a context object that holds references to the variables in scope when the function was originally created. Which variables get saved to the context object is an implementation detail of the JavaScript engine and is subject to various optimizations. For example, in V8, the JavaScript engine used in Chrome, unused variables might not be saved to the context object.
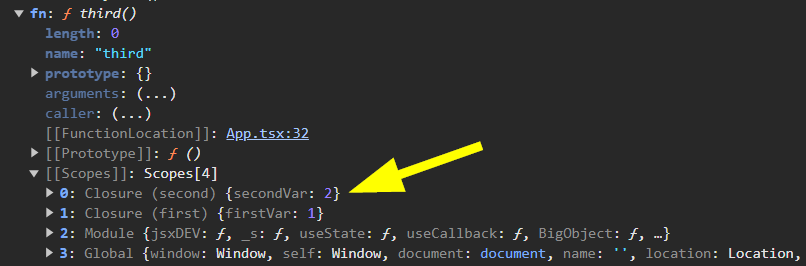
Since closures can be nested inside other closures, the innermost closures will hold references (through a so-called scope chain) to any outer function scope that they need to access. For example:
function first() {
  const firstVar = 1;
  function second() {
    // This is a closure over the firstVar variable
    const secondVar = 2;
    function third() {
      // This is a closure over the firstVar and secondVar variables
      console.log(firstVar, secondVar);
    }
    return third;
  }
  return second();
}

const fn = first(); // This will return the third function
fn(); // logs 1, 2
In this example, the third() function has access to the firstVar variable through the scope chain.
So, as long as the app holds a reference to the function, none of the variables in the closure scope can be garbage collected. Due to the scope chain, even the outer function scopes will remain in memory.
Check out this amazing article for a deep dive into the topic: Grokking V8 closures for fun (and profit?). Even though it’s from 2012, it’s still relevant and provides a great overview of how closures work in V8.
Closures and React
We heavily rely on closures in React for all functional components, hooks and event handlers. Whenever you create a new function that accesses a variable from the component’s scope, for example, a state or prop, you are most likely creating a closure.
Here’s an example:
import { useState, useEffect } from "react";

function App({ id }) {
  const [count, setCount] = useState(0);

  const handleClick = () => {
    setCount(count + 1); // This is a closure over the count variable
  };

  useEffect(() => {
    console.log(id); // This is a closure over the id prop
  }, [id]);

  return (
    <div>
      <p>{count}</p>
      <button onClick={handleClick}>Increment</button>
    </div>
  );
}
In most cases that in itself is not a problem. In the example above, the closures will be recreated on each render of App and the old ones will be garbage collected. That might mean some unnecessary allocations and deallocations, but those alone are generally very fast.
However, when our application grows and you start using memoization techniques like useMemo and useCallback to avoid unnecessary re-renders, there are some things to watch out for.
Closures and useCallback
With the memoization hooks, we trade better rendering performance for additional memory usage. useCallback will hold a reference to a function as long as the dependencies don’t change. Let’s look at an example:
import React, { useState, useCallback } from "react";

function App() {
  const [count, setCount] = useState(0);

  const handleEvent = useCallback(() => {
    setCount(count + 1);
  }, [count]);

  return (
    <div>
      <p>{count}</p>
      <ExpensiveChildComponent onMyEvent={handleEvent} />
    </div>
  );
}
In this example, we want to avoid re-renders of ExpensiveChildComponent. We can do this by trying to keep the handleEvent() function reference stable. We memoize handleEvent() with useCallback to only reassign a new value when the count state changes. We can then wrap ExpensiveChildComponent in React.memo() to avoid re-renders whenever the parent, App, renders. So far, so good.
But let’s add a little twist to the example:
import { useState, useCallback } from "react";

class BigObject {
  public readonly data = new Uint8Array(1024 * 1024 * 10); // 10MB of data
}

function App() {
  const [count, setCount] = useState(0);
  const bigData = new BigObject();

  const handleEvent = useCallback(() => {
    setCount(count + 1);
  }, [count]);

  const handleClick = () => {
    console.log(bigData.data.length);
  };

  return (
    <div>
      <button onClick={handleClick} />
      <ExpensiveChildComponent2 onMyEvent={handleEvent} />
    </div>
  );
}
Can you guess what happens?
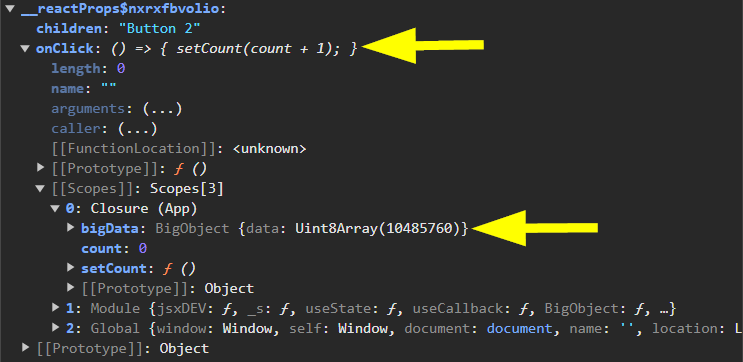
Since handleEvent() creates a closure over the count variable, it will hold a reference to the component’s context object. And, even though we never access bigData in the handleEvent() function, handleEvent() will still hold a reference to bigData through the component’s context object.
All closures share a common context object from the time they were created. Since handleClick() closes over bigData, bigData will be referenced by this context object. This means, bigData will never get garbage collected as long as handleEvent() is being referenced. This reference will hold until count changes and handleEvent() is recreated.
An infinite memory leak with useCallback + closures + large objects
Let us have a look at one last example that takes all the above to the extreme. This example is a reduced version of what I encountered in our application. So while the example might seem contrived, it shows the general problem quite well.
import { useState, useCallback } from "react";

class BigObject {
  public readonly data = new Uint8Array(1024 * 1024 * 10);
}

export const App = () => {
  const [countA, setCountA] = useState(0);
  const [countB, setCountB] = useState(0);
  const bigData = new BigObject(); // 10MB of data

  const handleClickA = useCallback(() => {
    setCountA(countA + 1);
  }, [countA]);

  const handleClickB = useCallback(() => {
    setCountB(countB + 1);
  }, [countB]);

  // This only exists to demonstrate the problem
  const handleClickBoth = () => {
    handleClickA();
    handleClickB();
    console.log(bigData.data.length);
  };

  return (
    <div>
      <button onClick={handleClickA}>Increment A</button>
      <button onClick={handleClickB}>Increment B</button>
      <button onClick={handleClickBoth}>Increment Both</button>
      <p>
        A: {countA}, B: {countB}
      </p>
    </div>
  );
};
In this example, we have two memoized event handlers handleClickA() and handleClickB(). We also have a function handleClickBoth() that calls both event handlers and logs the length of bigData.
Can you guess what happens when we alternate between clicking the “Increment A” and “Increment B” buttons?
Let’s take a look at the memory profile in Chrome DevTools after clicking each of these buttons 5 times:
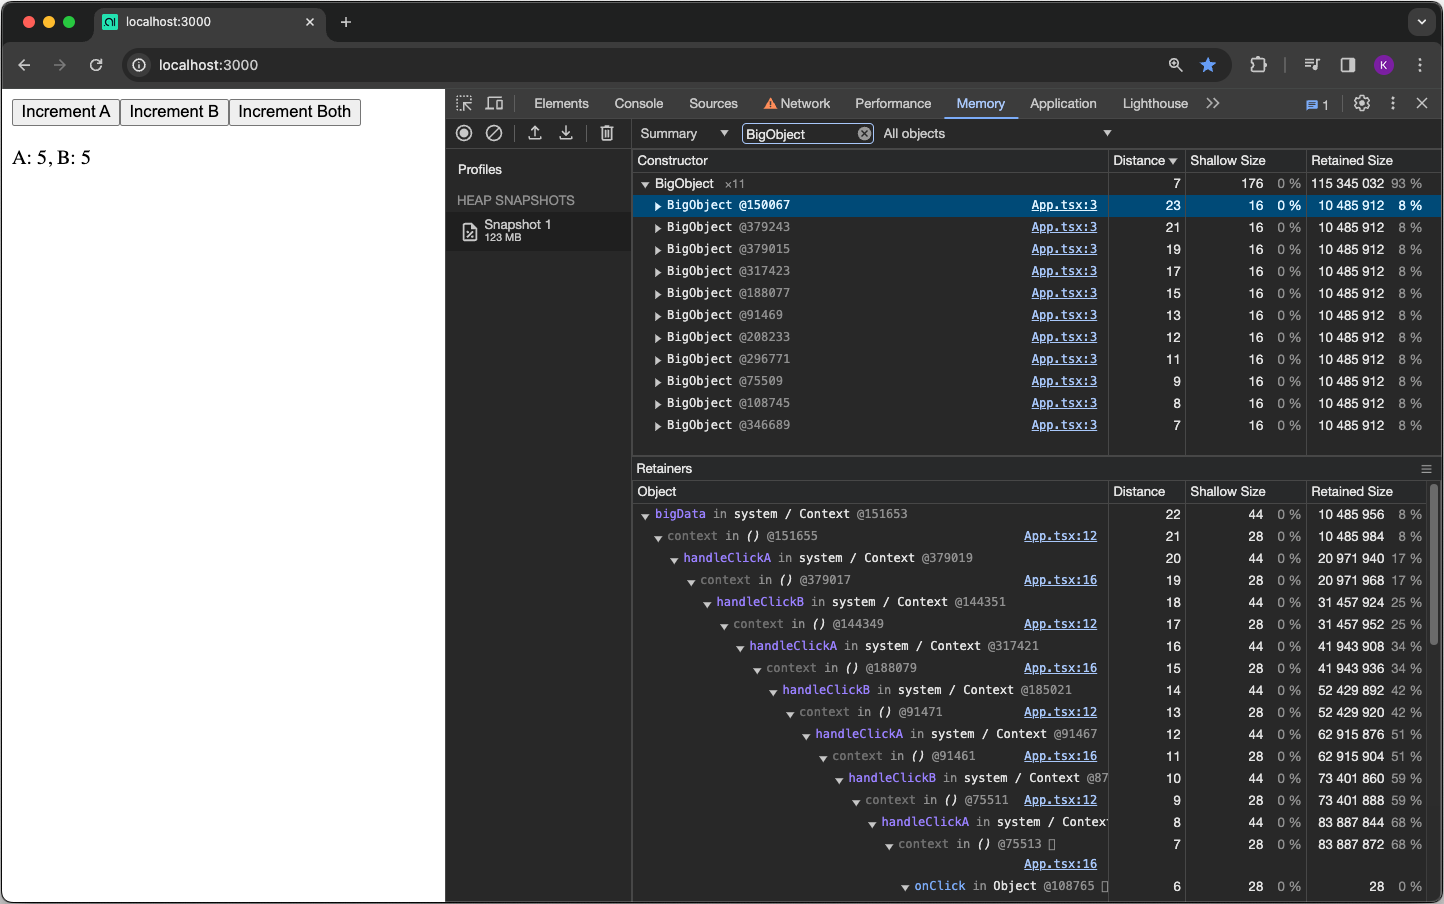
Seems like bigData never gets garbage collected. The memory usage keeps growing and growing with each click. In our case, the application holds references to 11 BigObject instances, each 10MB in size. One for the initial render and one for each click.
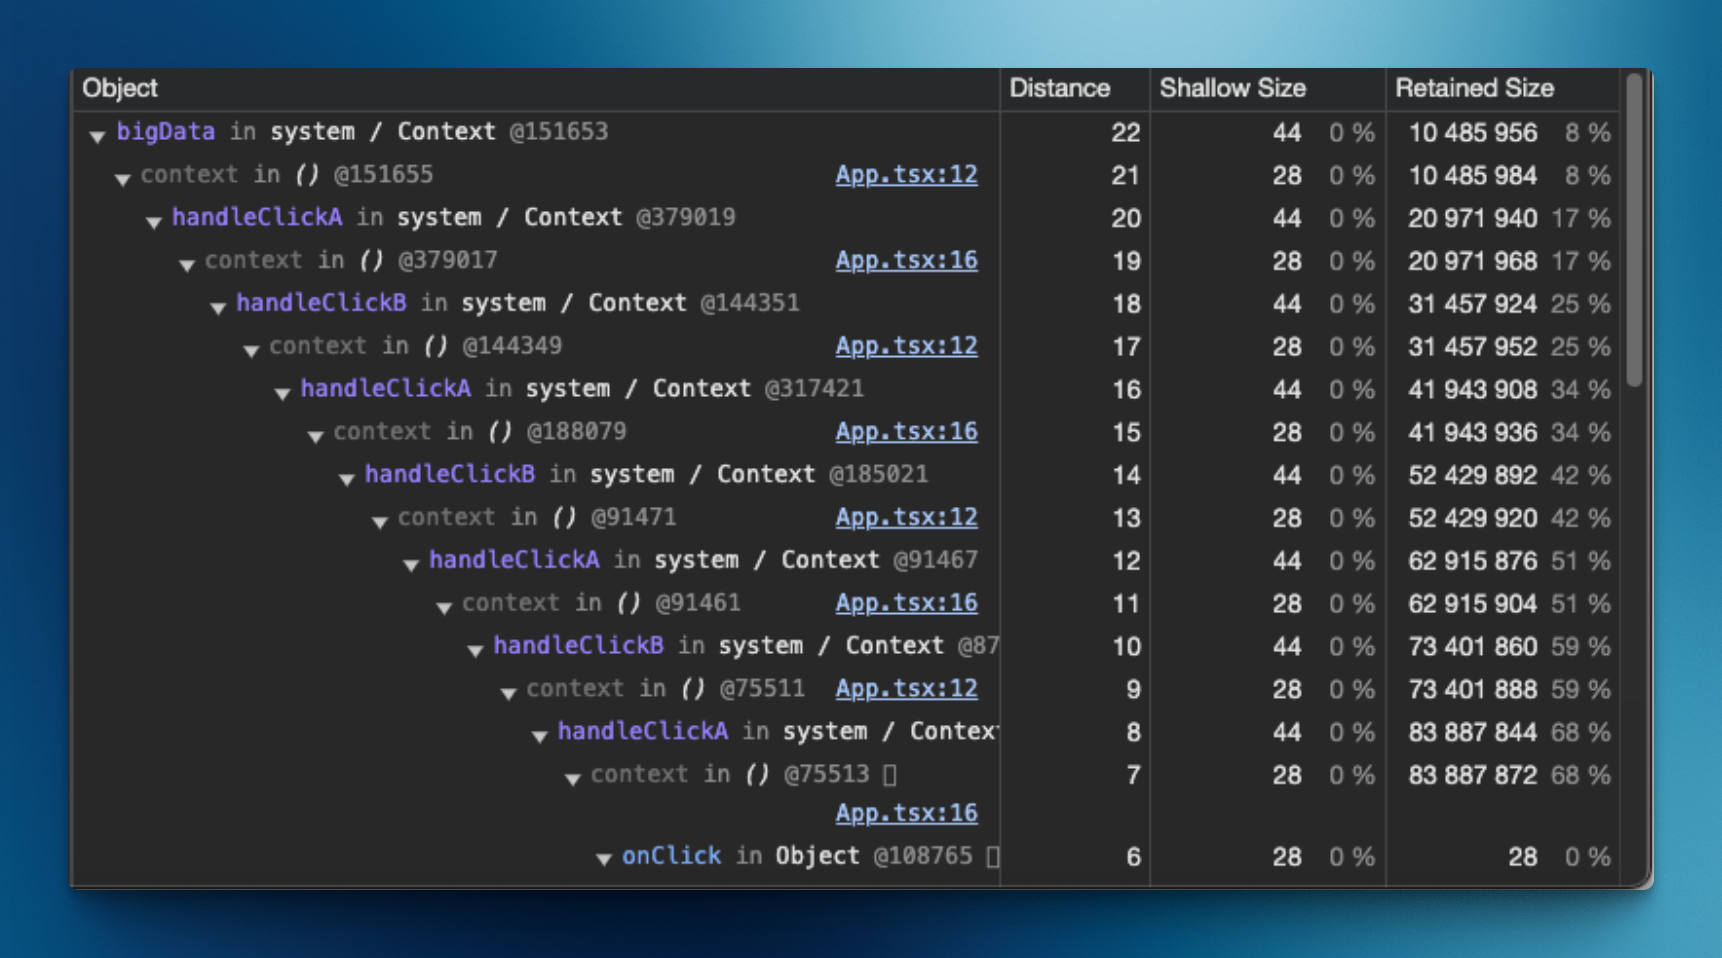
The retention tree gives us an indication of what’s going on. Looks like we’re creating a repeating chain of references. Let’s go through it step by step.
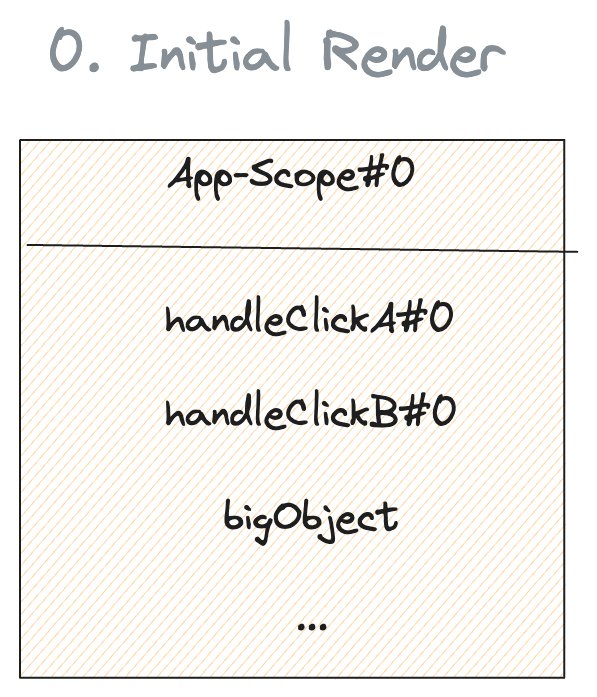
0. First render:
When App is first rendered, it creates a closure scope that holds references to all the variables since we use all of them in at least one closure. This includes bigData, handleClickA(), and handleClickB(). We reference them in handleClickBoth(). Let’s call the closure scope AppScope#0.
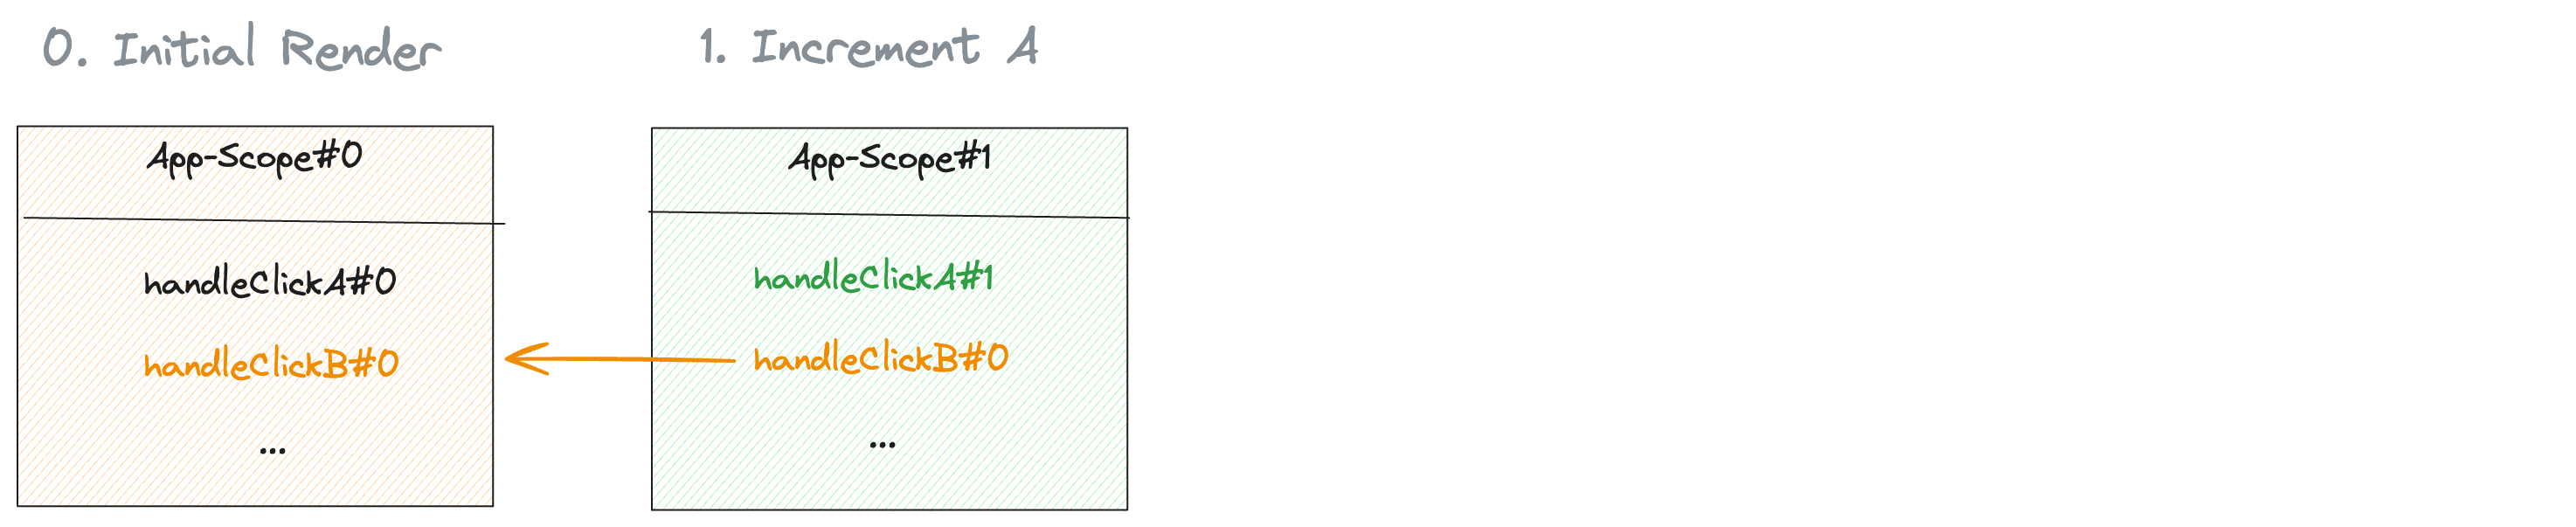
1. Click on “Increment A”:
- The first click on “Increment A” will cause
handleClickA()to be recreated since we changecountA- let’s call the new onehandleClickA()#1. handleClickB()#0will not get recreated sincecountBdidn’t change.- This means, however, that
handleClickB()#0will still hold a reference to the previousAppScope#0. - The new
handleClickA()#1will hold a reference toAppScope#1, which holds a reference tohandleClickB()#0.
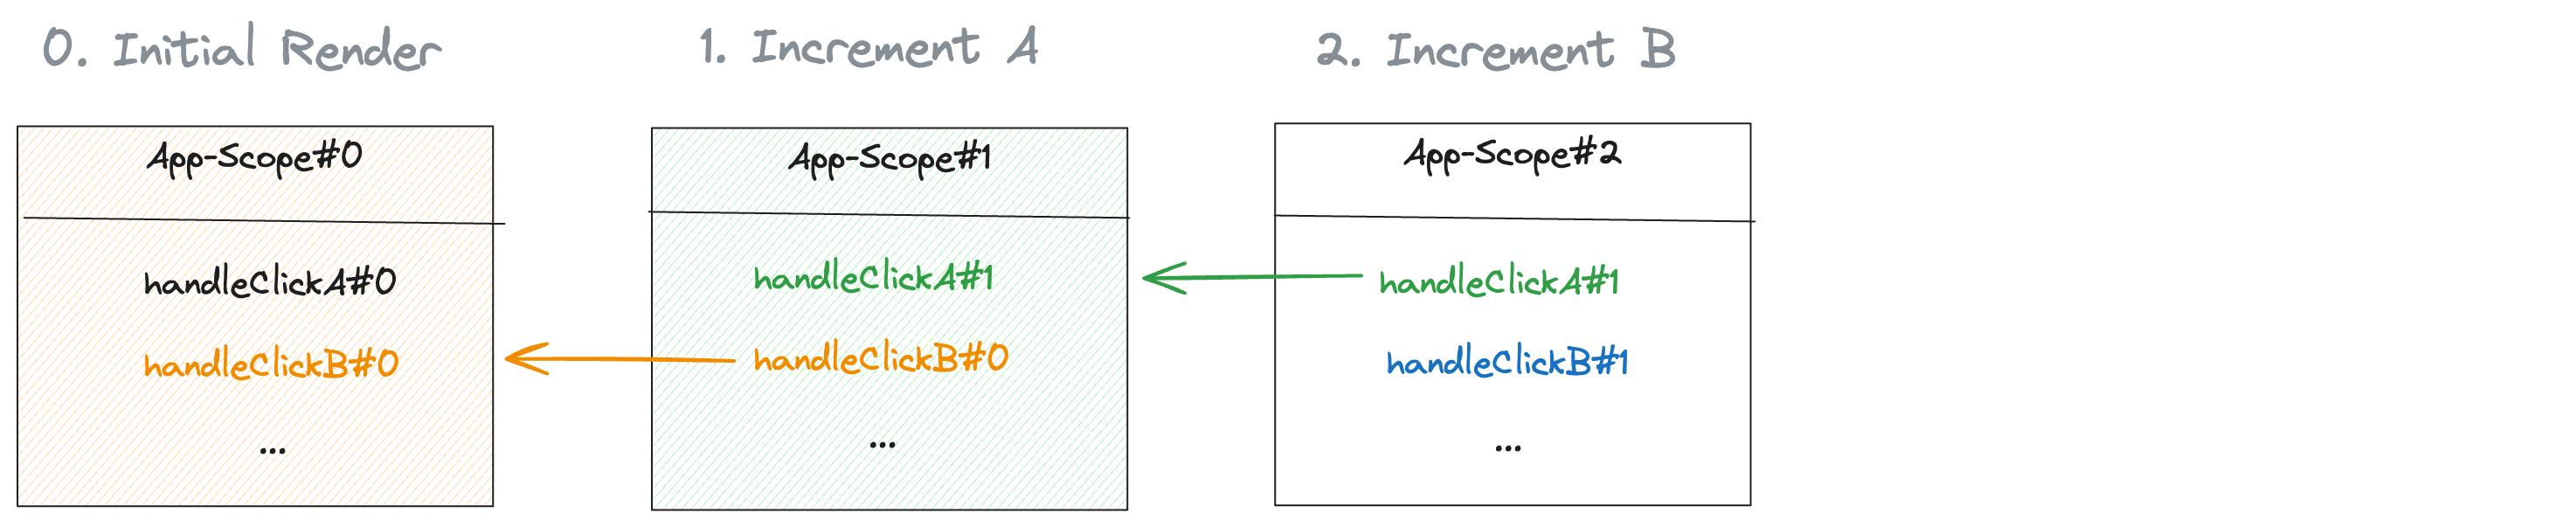
2. Click on “Increment B”:
- The first click on “Increment B” will cause
handleClickB()to be recreated since we changecountB, thus creatinghandleClickB()#1. - React will not recreate
handleClickA()sincecountAdidn’t change. handleClickB()#1will thus hold a reference toAppScope#2, which holds a reference tohandleClickA()#1, which holds a reference toAppScope#1, which holds a reference tohandleClickB()#0.
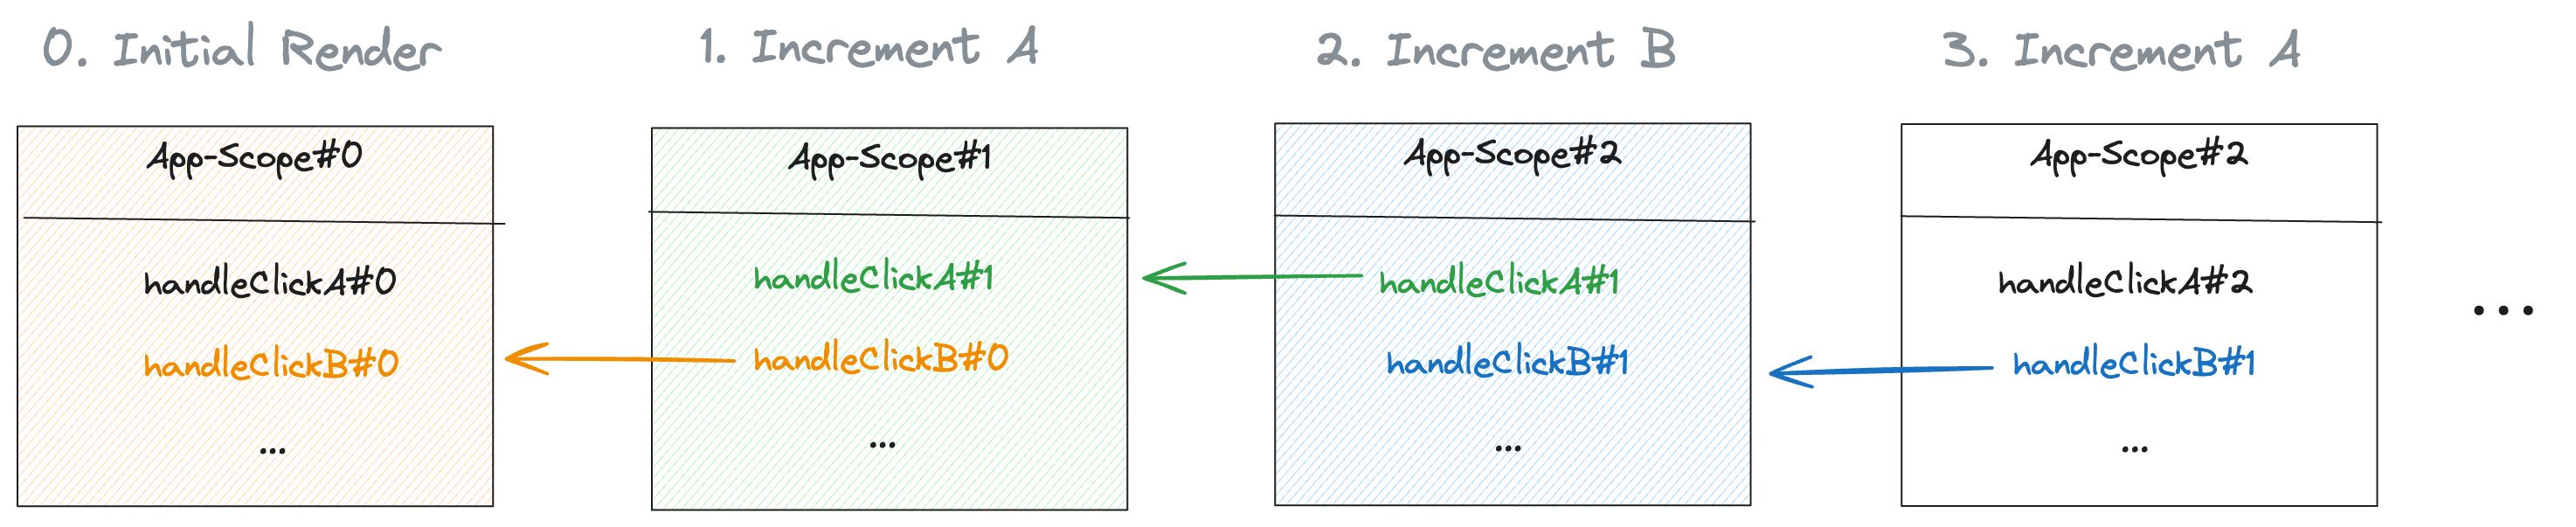
3. Second click on “Increment A”:
This way, we can create an endless chain of closures that reference each other and never get garbage collected, all the while lugging around a separate 10MB bigData object because that gets recreated on each render.
The general problem in a nutshell
The general problem is that different useCallback hooks in a single component might reference each other and other expensive data through the closure scopes. The closures are then held in memory until the useCallback hooks are recreated. Having more than one useCallback hook in a component makes it super hard to reason about what’s being held in memory and when it’s being released. The more callbacks you have, the more likely it is that you’ll encounter this issue.
Will this ever be a problem for you?
Here are some factors that will make it more likely that you’ll run into this problem:
- You have some large components that are hardly ever recreated, for example, an app shell that you lifted a lot of state to.
- You rely on
useCallbackto minimize re-renders. - You call other functions from your memoized functions.
- You handle large objects like image data or big arrays.
If you don’t need to handle any large objects, referencing a couple of additional strings or numbers might not be a problem. Most of these closure cross references will clear up after enough properties change. Just be aware that your app might hold on to more memory than you’d expect.
How to avoid memory leaks with closures and useCallback?
Here are a few tips I can give you to avoid this problem:
Tip 1: Keep your closure scopes as small as possible.
JavaScript makes it very hard to spot all the variables that are being captured. The best way to avoid holding on to too many variables is to reduce function size around the closure. This means:
- Write smaller components. This will reduce the number of variables that are in scope when you create a new closure.
- Write custom hooks. Because then any callback can only close over the scope of the hook function. This will often only mean the function arguments.
Tip 2: Avoid capturing other closures, especially memoized ones.
Even though this seems obvious, React makes it easy to fall into this trap. If you write smaller functions that call each other, once you add in the first useCallback there is a chain reaction of all called functions within the component scope to be memoized.
Tip 3: Avoid memoization when it’s not necessary.
useCallback and useMemo are great tools to avoid unnecessary re-renders, but they come with a cost. Only use them when you notice performance issues due to renders.
Tip 4 (escape hatch): Use useRef for large objects.
This might mean, that you need to handle the object’s lifecycle yourself and clean it up properly. Not optimal, but it’s better than leaking memory.
Conclusion
Closures are a heavily used pattern in React. They allow our functions to remember the props and states that were in scope when the component was last rendered. This can lead to unexpected memory leaks when combined with memoization techniques like useCallback, especially when working with large objects. To avoid these memory leaks, keep your closure scopes as small as possible, avoid memoization when it’s not necessary, and possibly fall back to useRef for large objects.
Big thanks to David Glasser for his 2013 article A surprising JavaScript memory leak found at Meteor that pointed me in the right direction.
Feedback?
Do you think I missed something or got something wrong? Maybe you have a better solution to the problem or never encountered it in the first place.
If you have any questions or comments, please feel free to reach out to me on LinkedIn or X/Twitter.
Happy debugging!